


Solutions
Solar PV Plant Energy Online Monitoring and Prepaid Solution
Application
Establish a complete monitoring system.Install a smart wireless 3-phase energy meter with bidirectional metering function on Grids Side [Need to monitor the girds' overall 3-phase incoming circuit so that we can monitor the total power consumption supplied from grids to house loads and also monitor the over-generated reflux energy from Solar PV to grids or power transformer.]
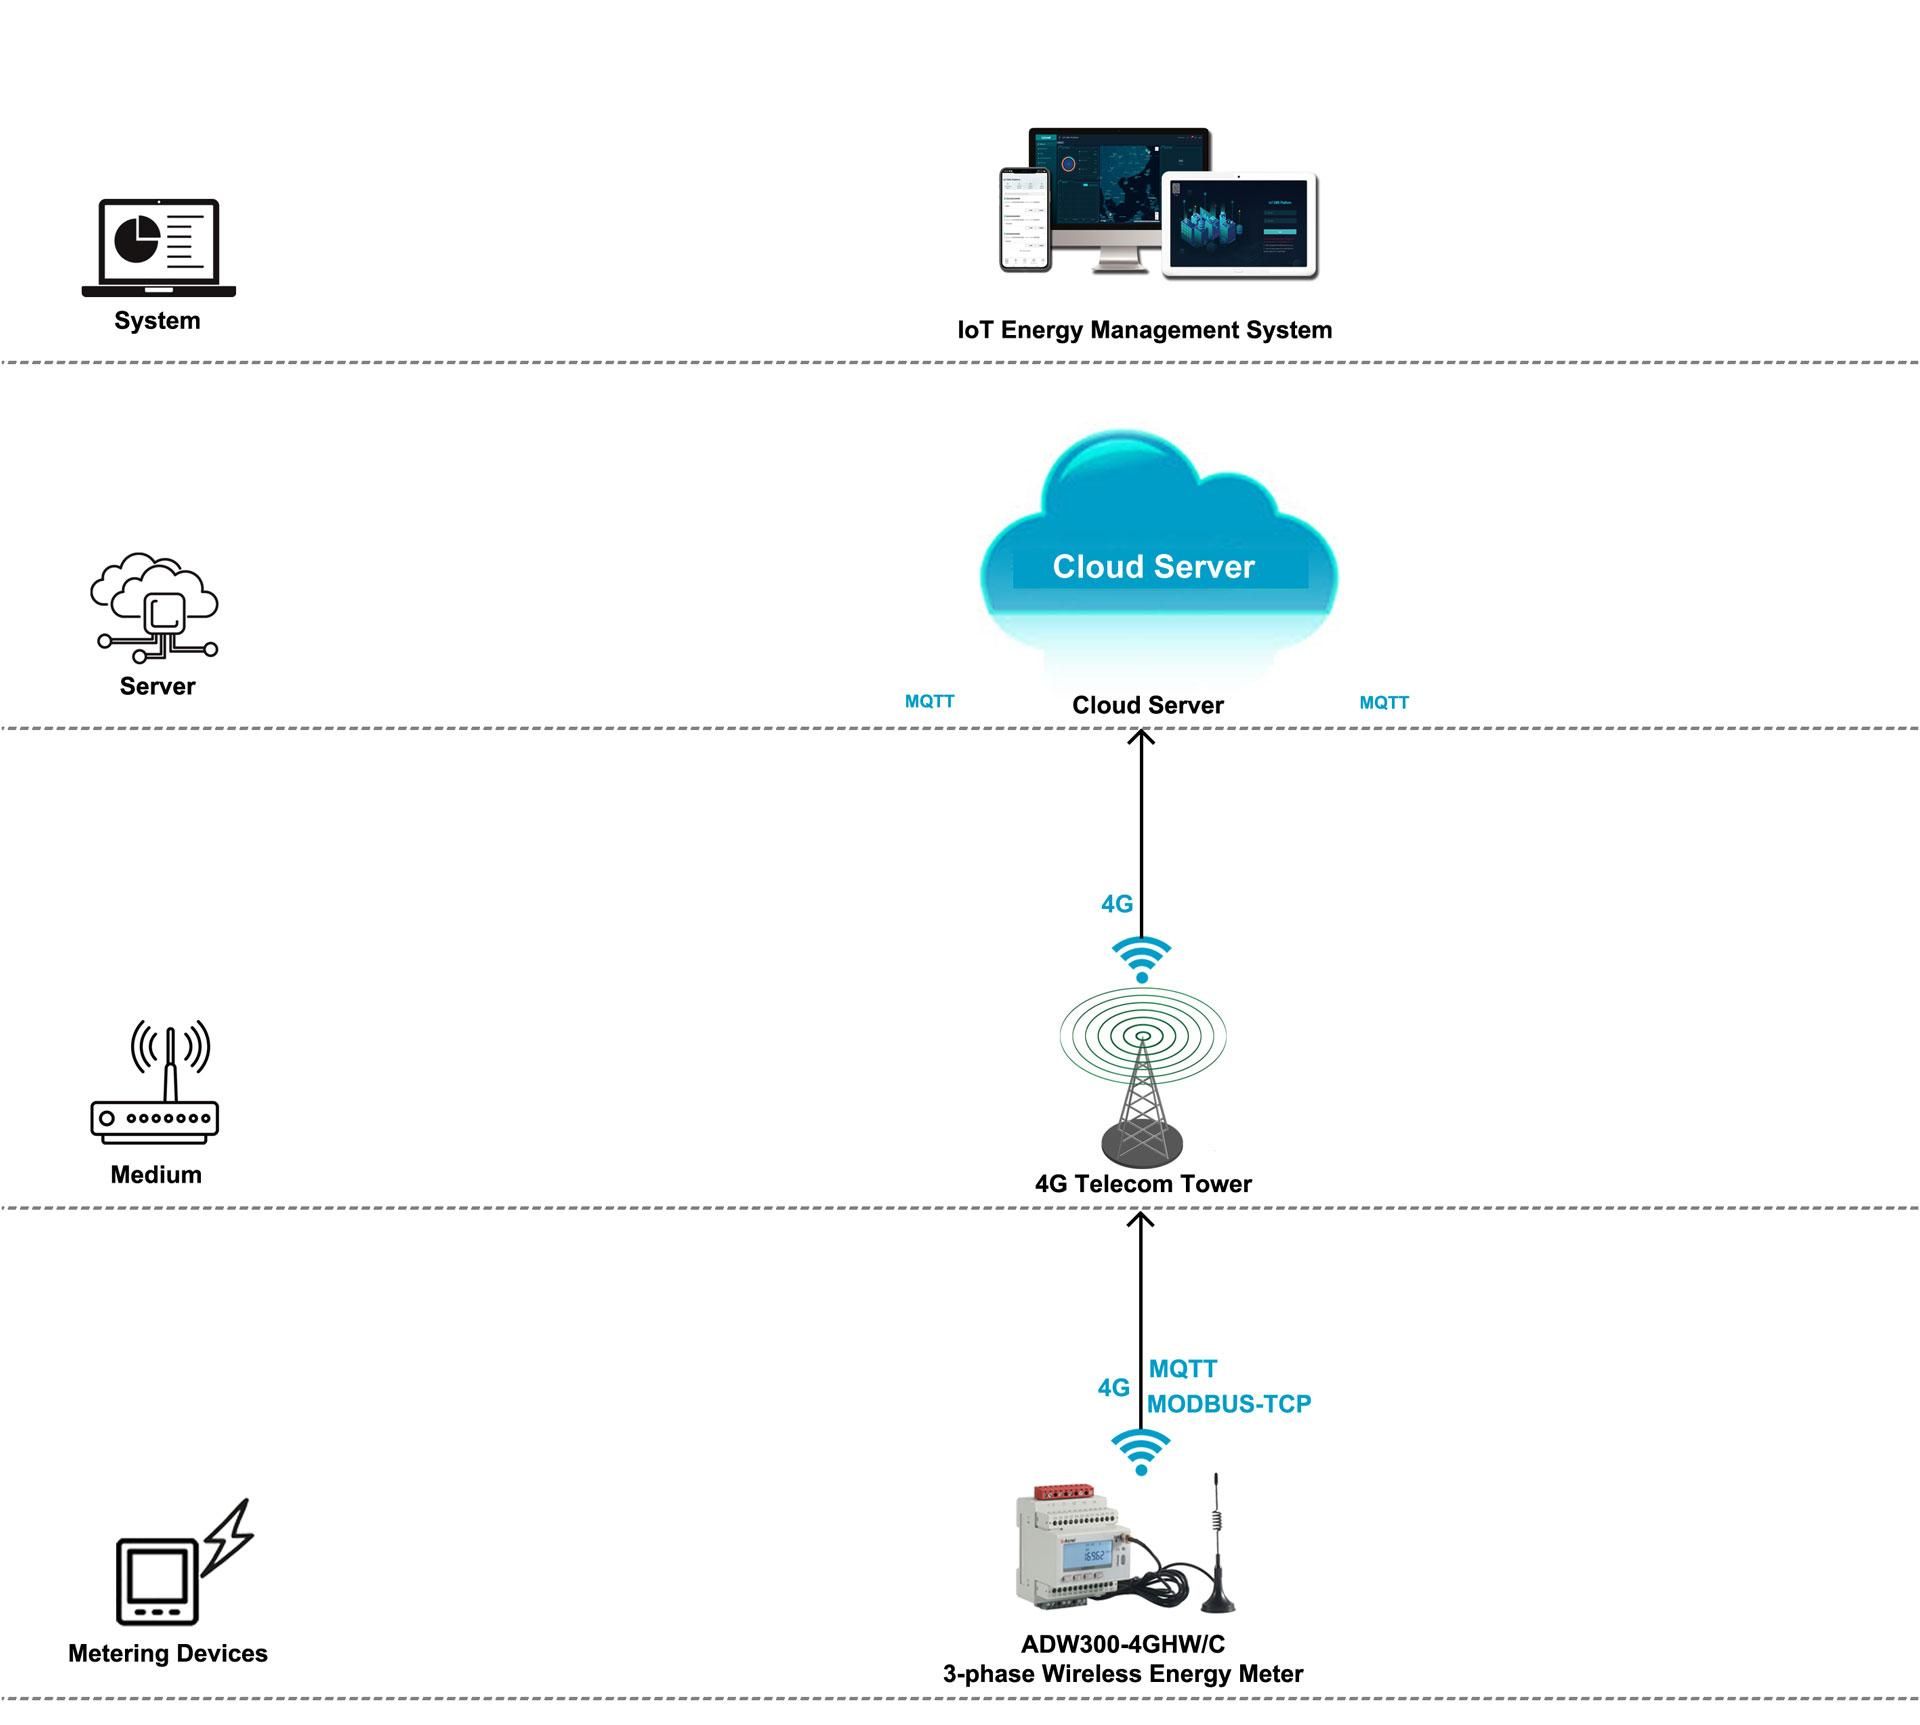
Structure
Calculation Logic
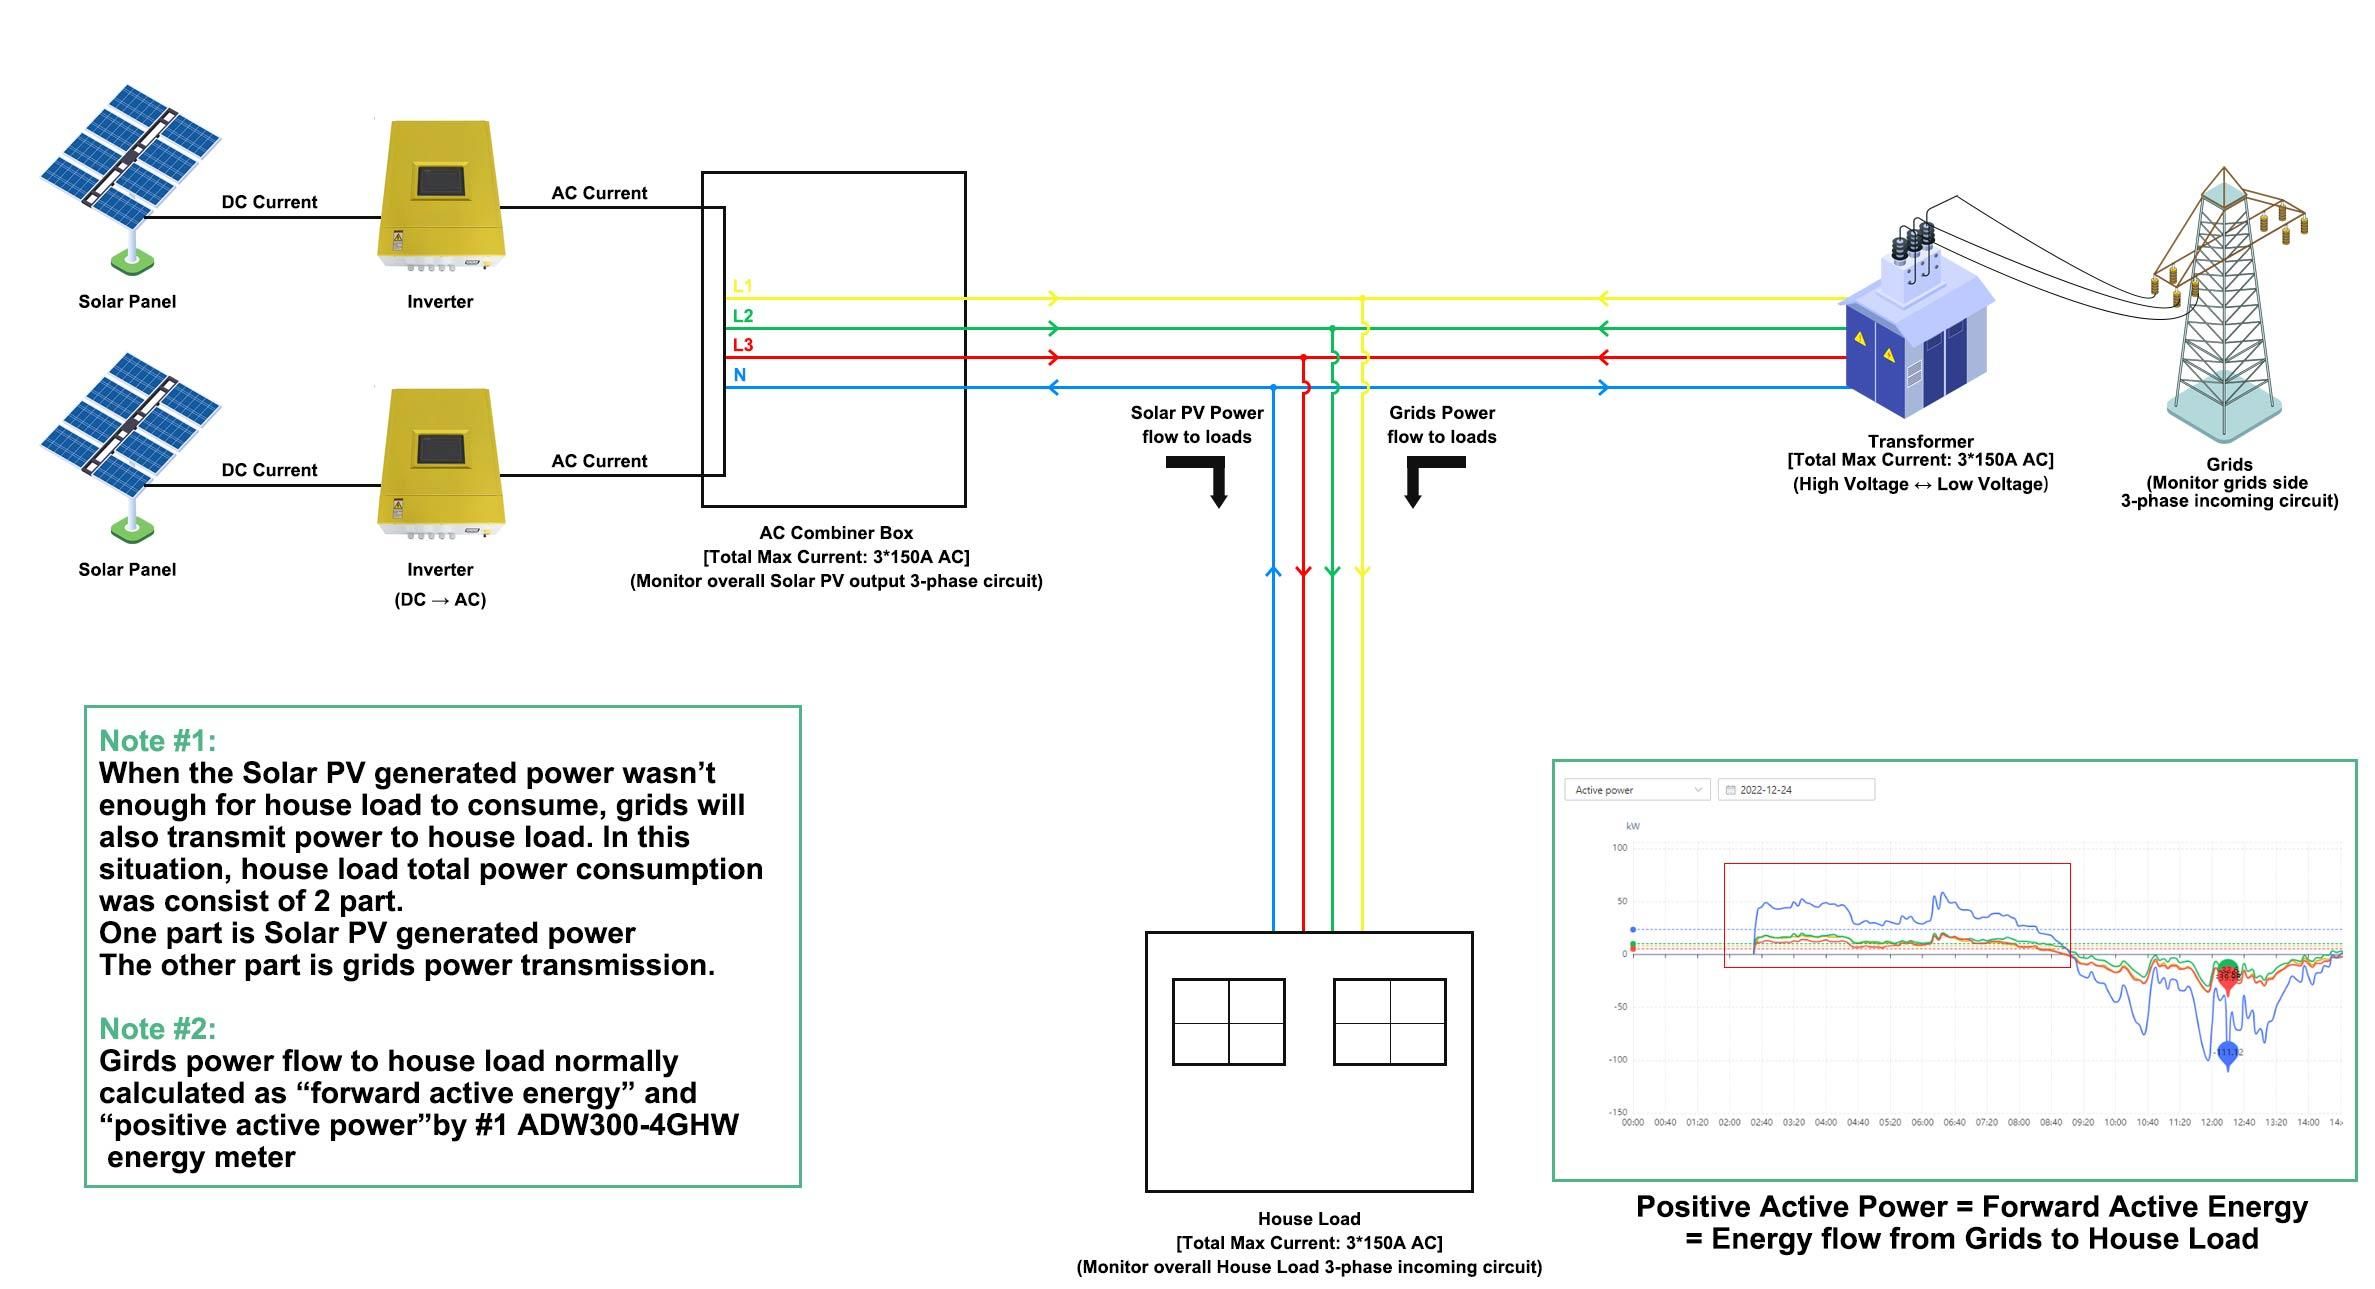
3.2When the Solar PV Generated Power > House Load Consumed Power
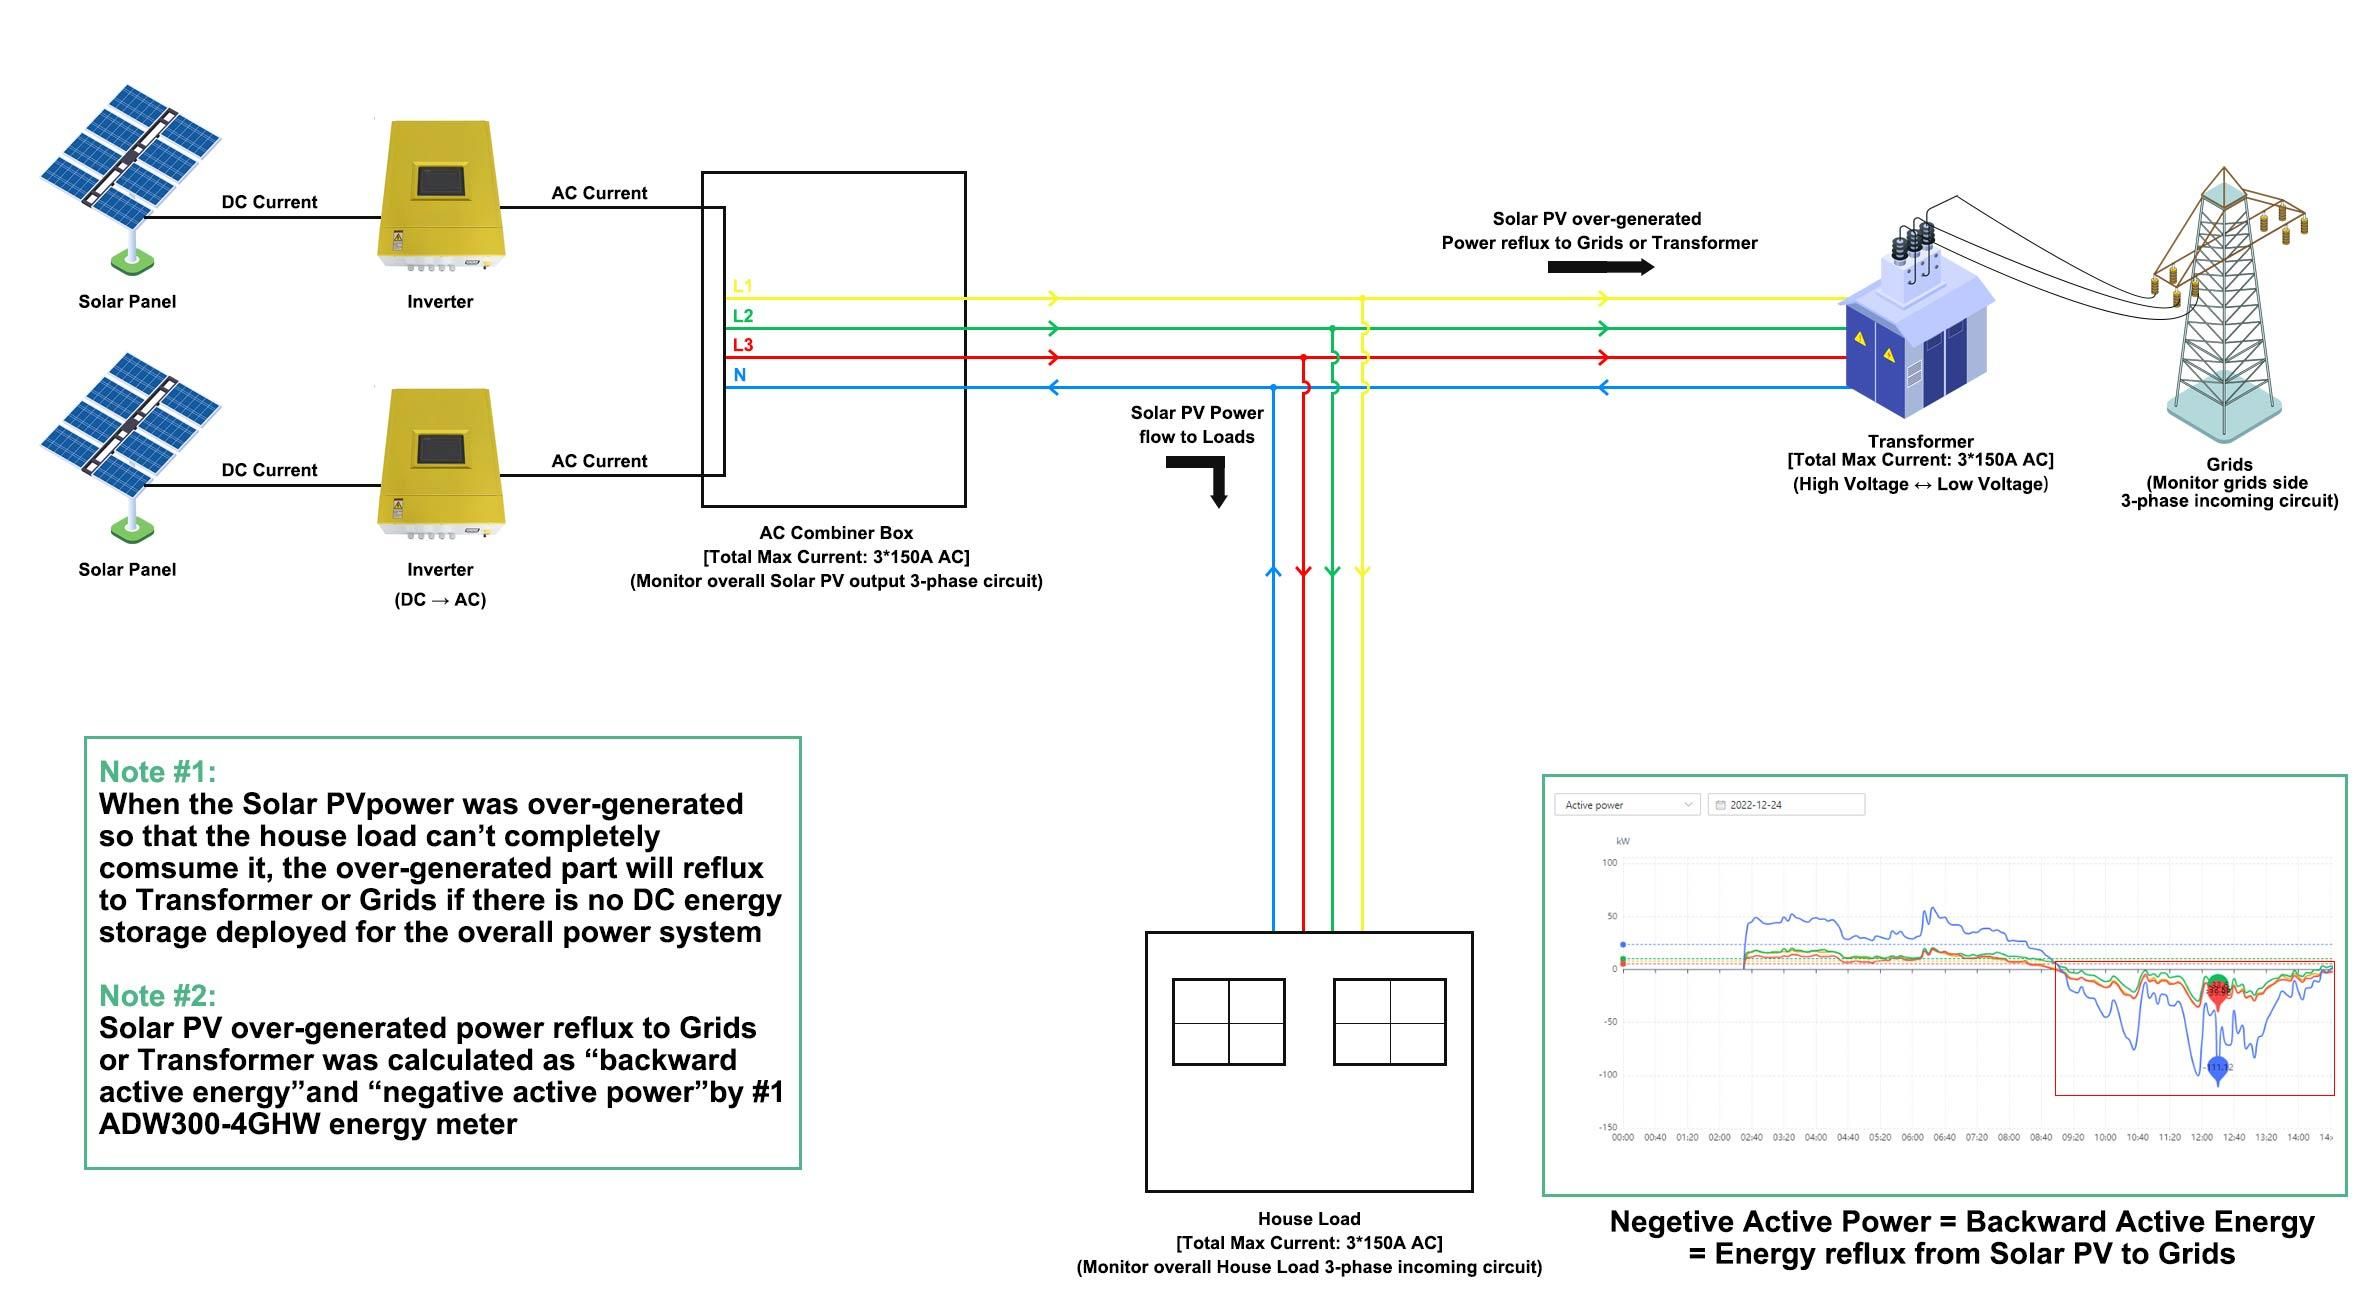
(1) When the solar PV generated power was larger than house loads power consumtpion. The part of over-generated solar PV power will reflux to power transformer or grids. In this situation, solar PV power generation will be distributed to 2 part, to house loads and to power transformer or girds.
(2) Solar PV over-generated power which reflux to power transformer or girds was normally
calculated as "backward active energy, EPE" and "negative active power, -kw" by #1 ADW300-
4GHW energy meter.
4.System Functions
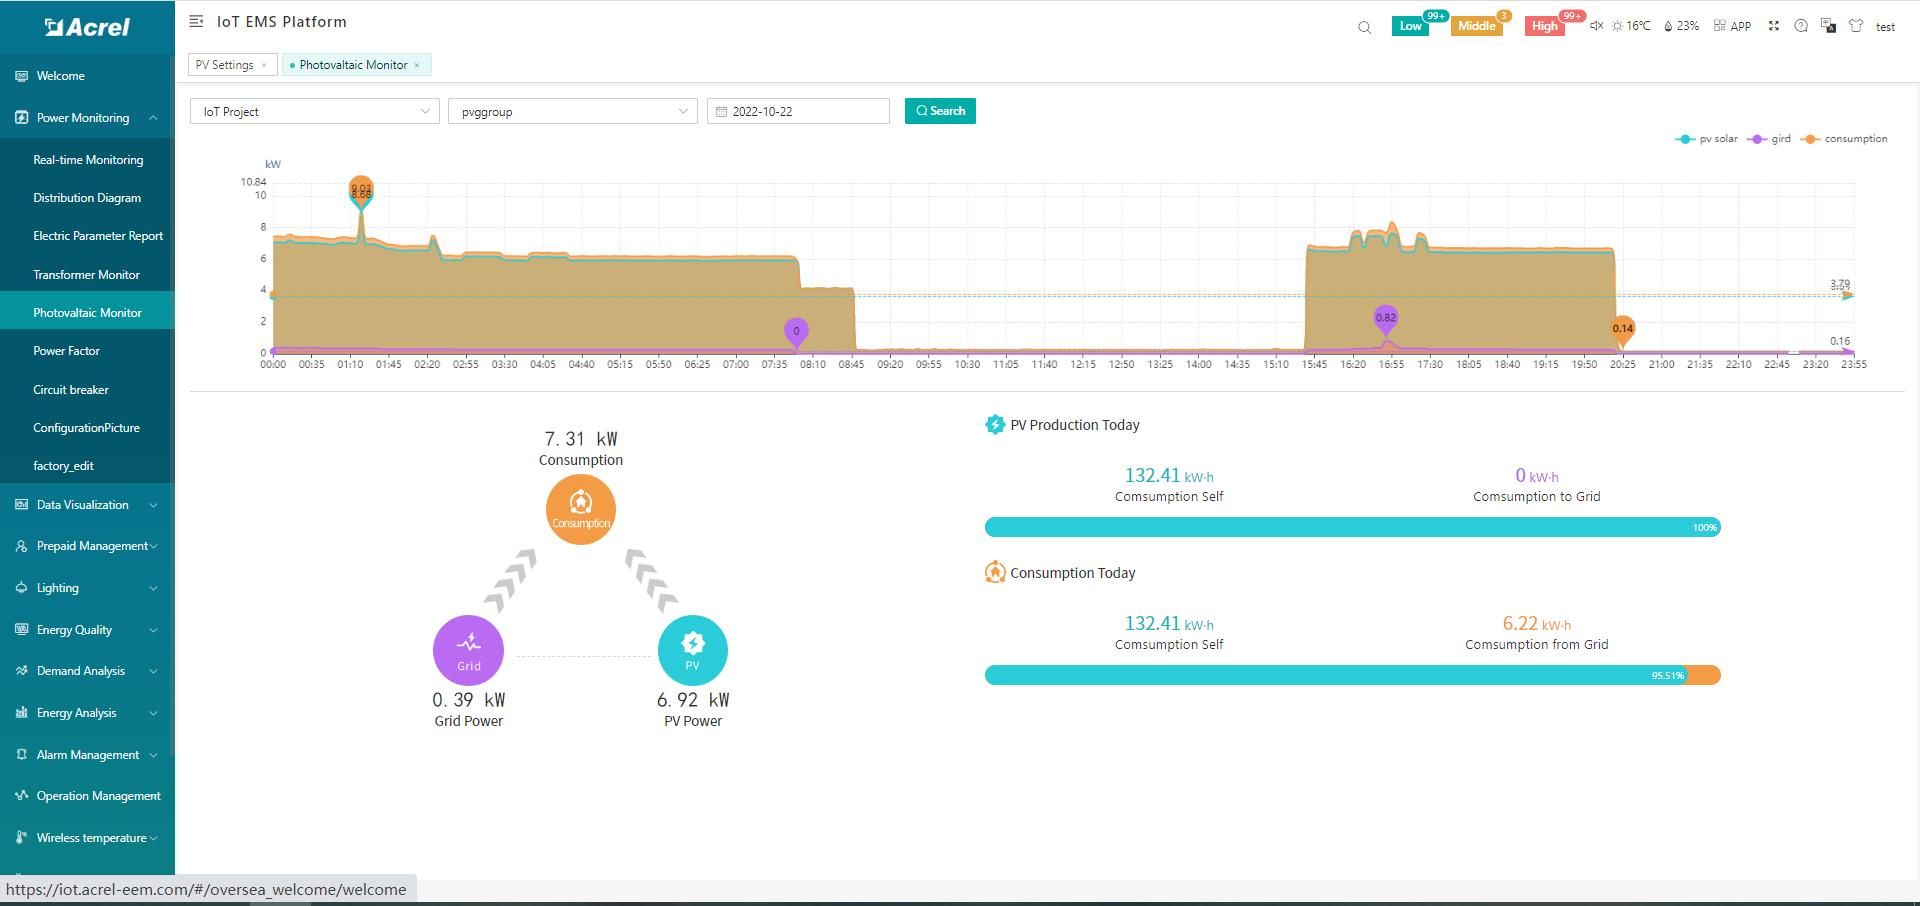
4.1 Solar PV Monitoring:
Overview of overall loads' power consumption, Solar PV total power generation, energy supplied by grids that consumed by loads, over-generated Solar PV power flux to grids or power
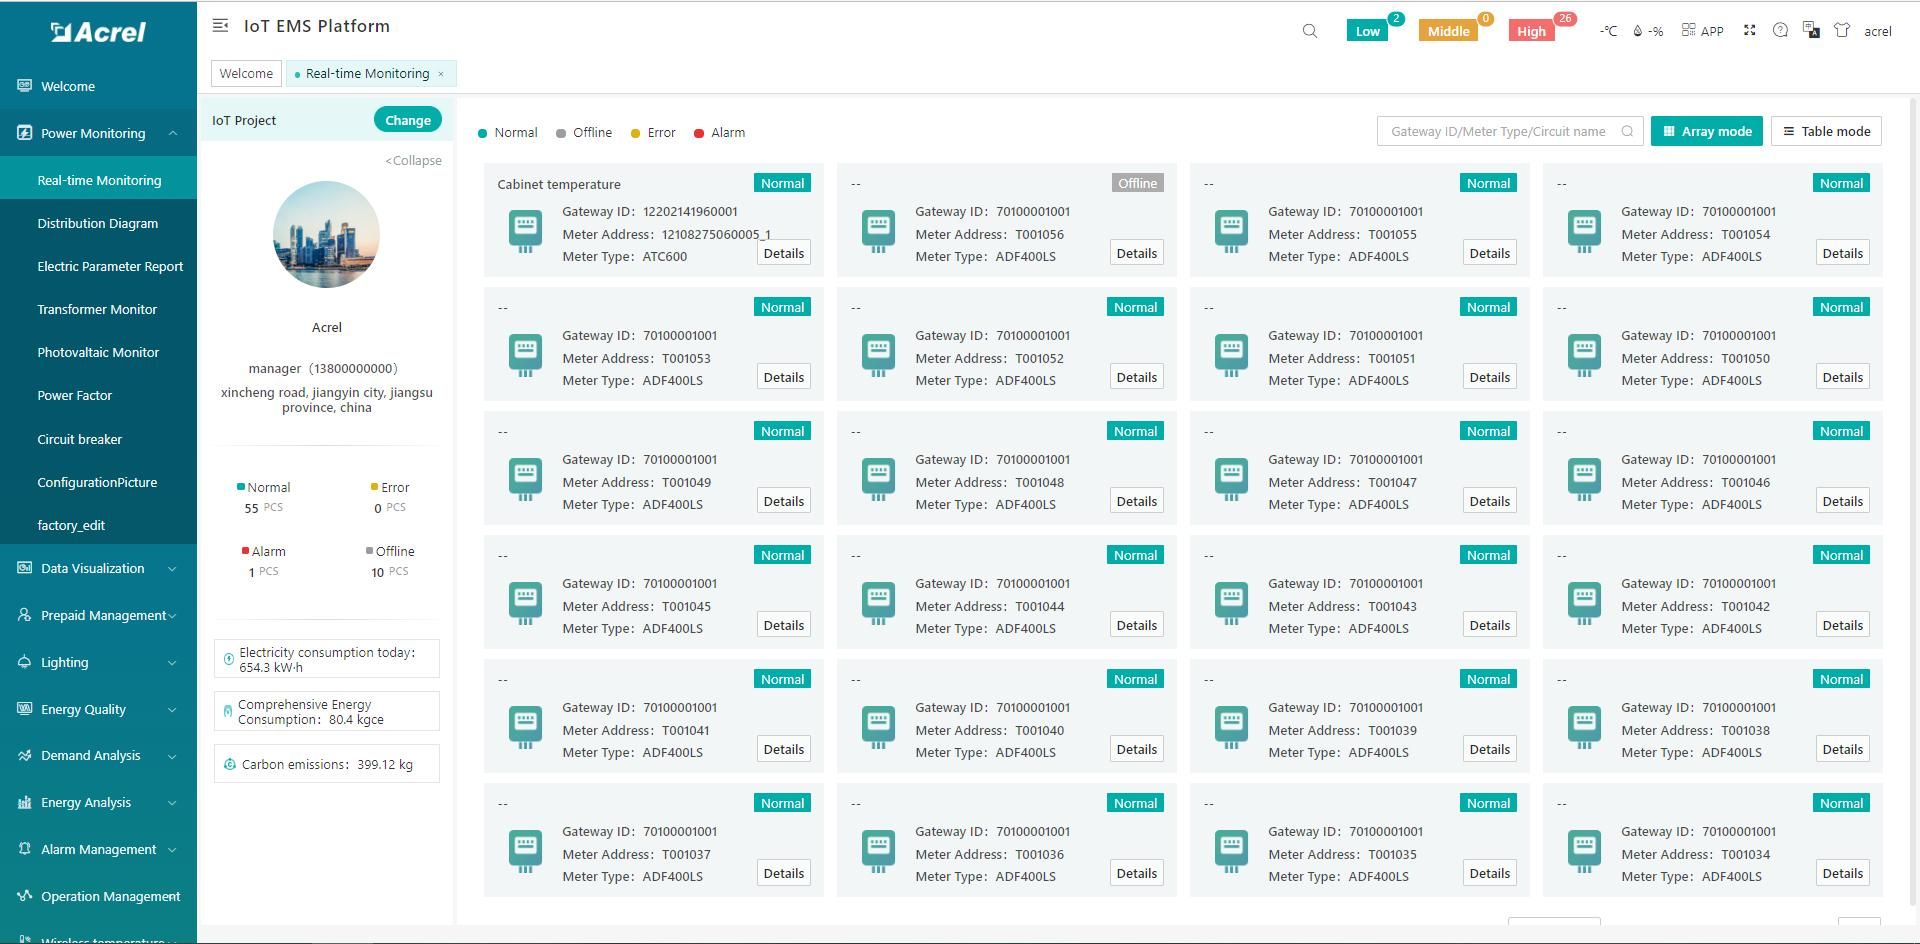
 4.2 Devices List:
Showing the overall devices connected to Acrel System and were bond to certain project. SN code, Online-Offline status, devices model and other necessary information will be shown here.
4.2 Devices List:
Showing the overall devices connected to Acrel System and were bond to certain project. SN code, Online-Offline status, devices model and other necessary information will be shown here.
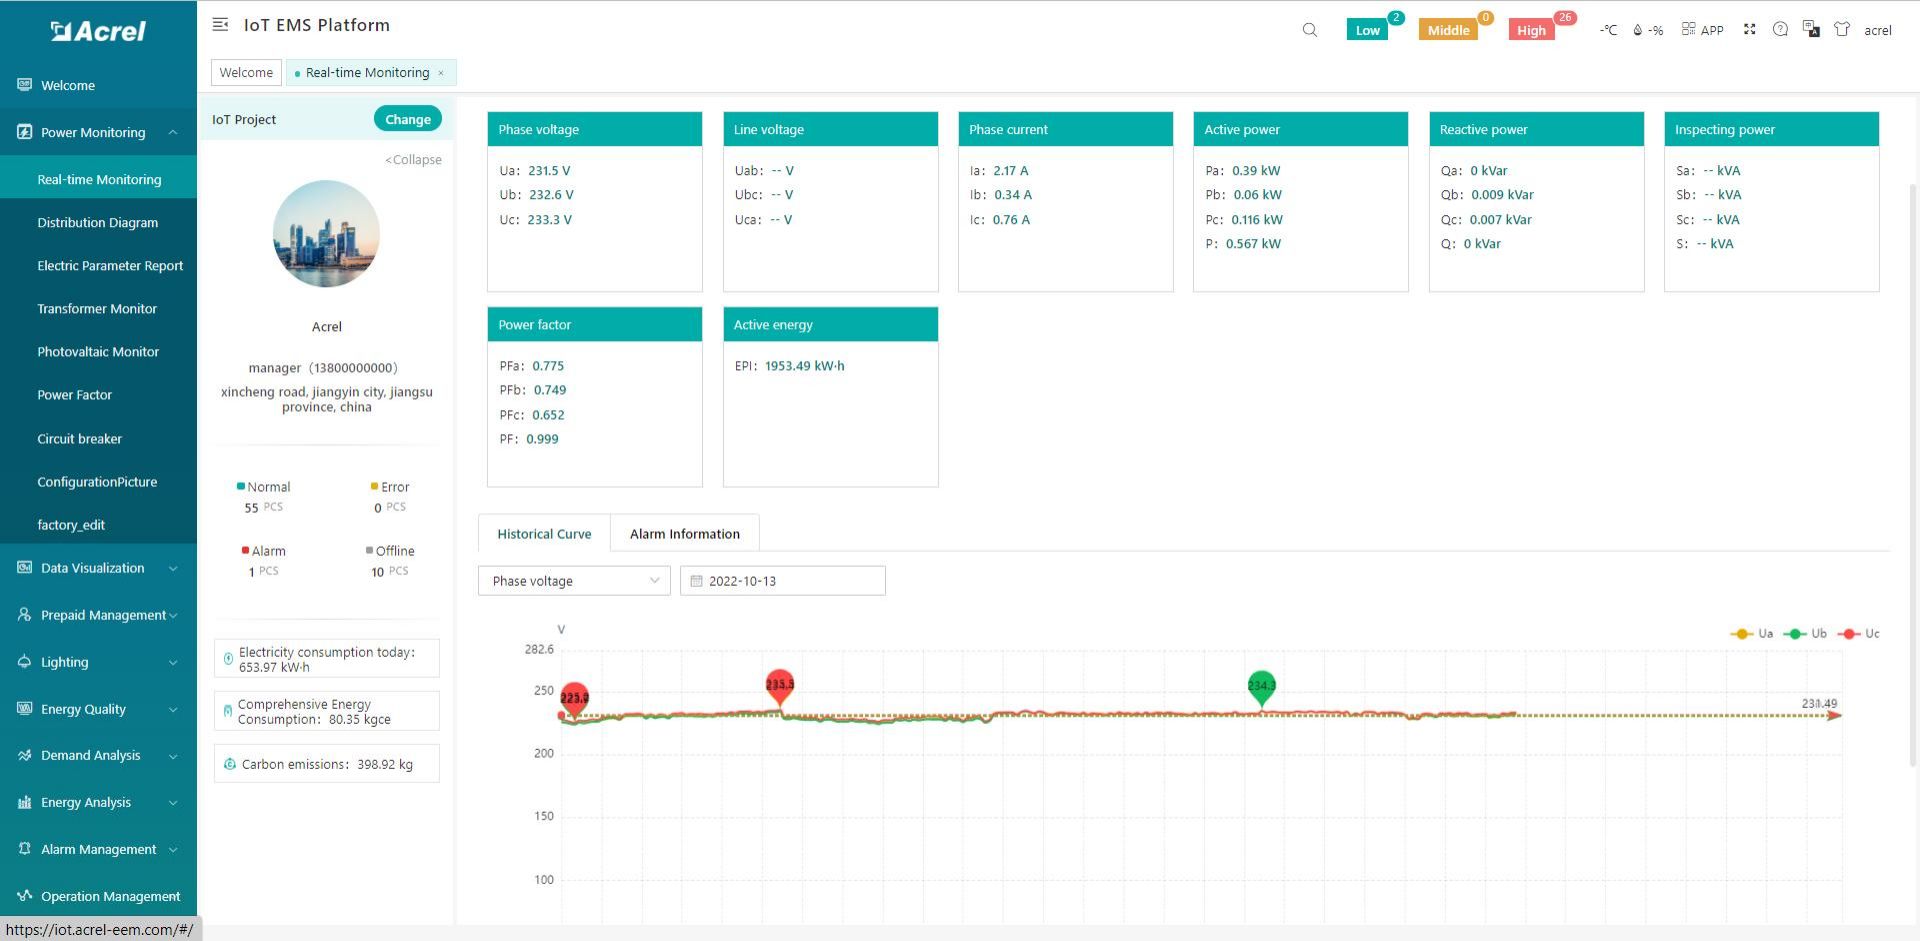
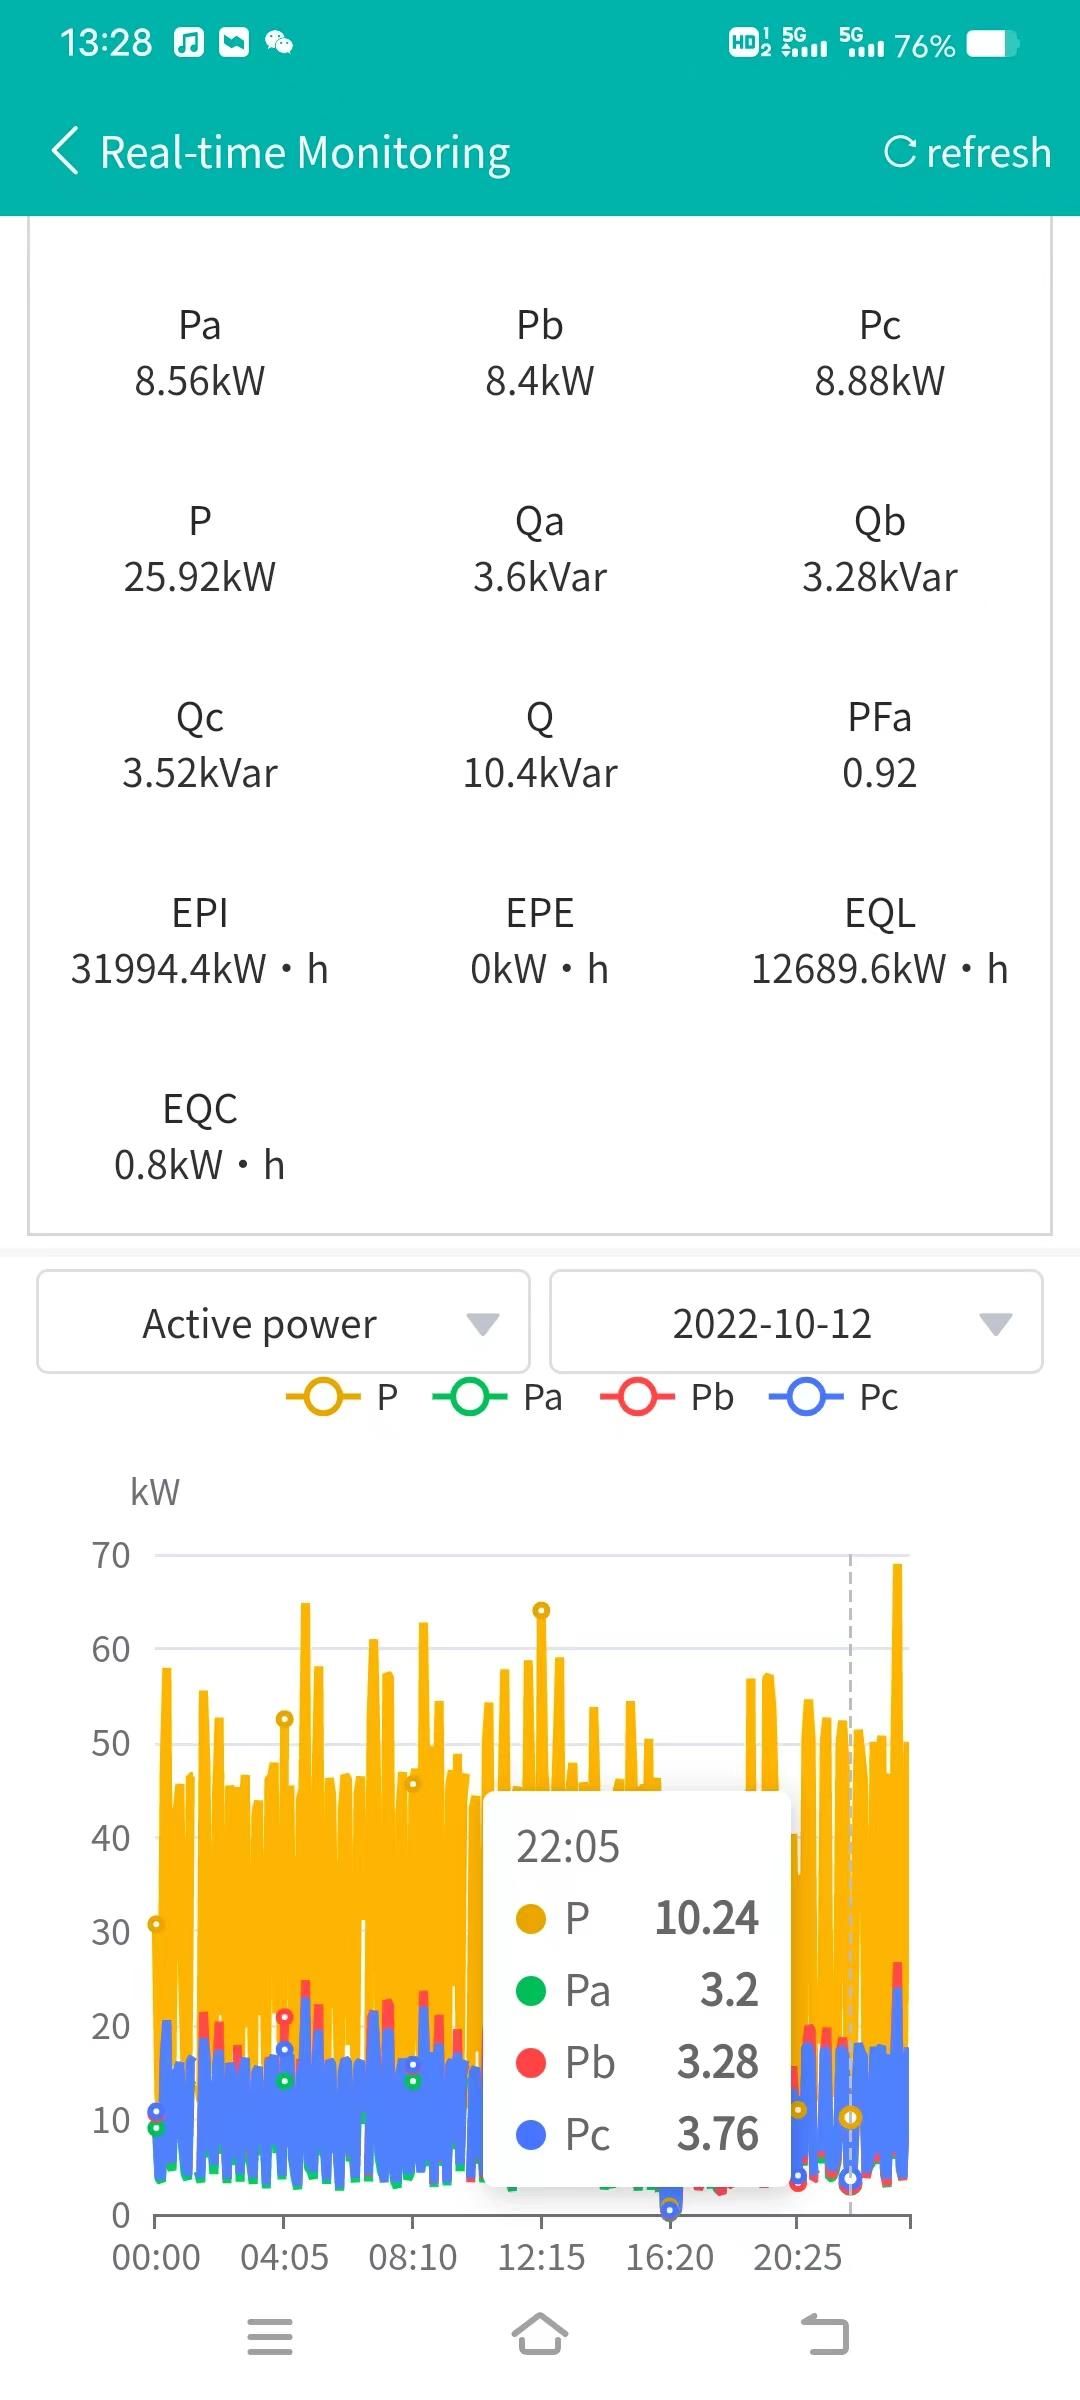
 4.3History Curve:
Showing the daily history data curve of all the data that could be collected and uploaded by energy meter or other basic metering devices.
By selecting the items of "date" and "electricity parameter", platform can show the history curve of different data and date.
4.3History Curve:
Showing the daily history data curve of all the data that could be collected and uploaded by energy meter or other basic metering devices.
By selecting the items of "date" and "electricity parameter", platform can show the history curve of different data and date.
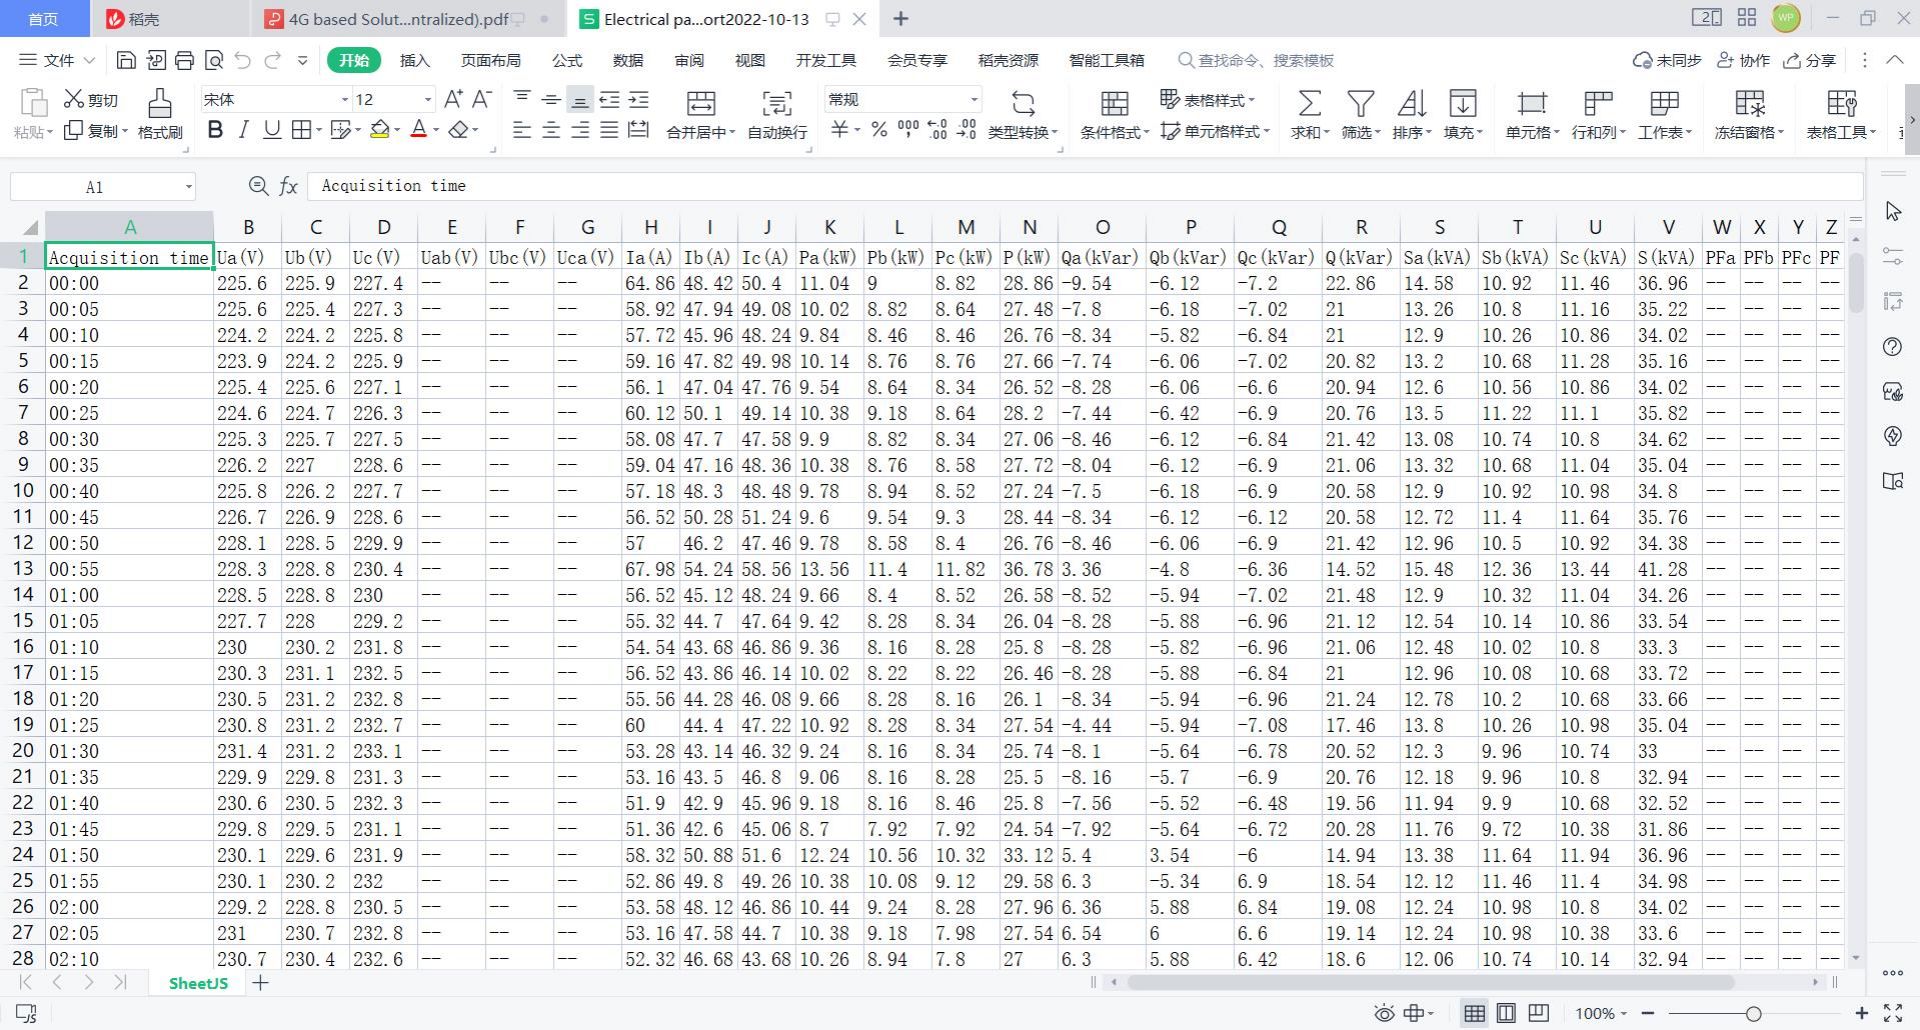
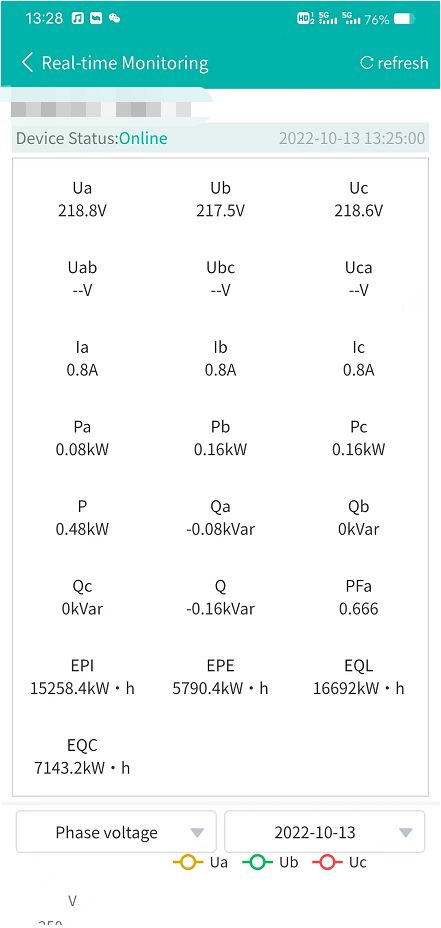
 4.4Electricity Parameters Report:
All the electricity parameters that could be collected by certain energy meter will showed as a report here.
4.4Electricity Parameters Report:
All the electricity parameters that could be collected by certain energy meter will showed as a report here.
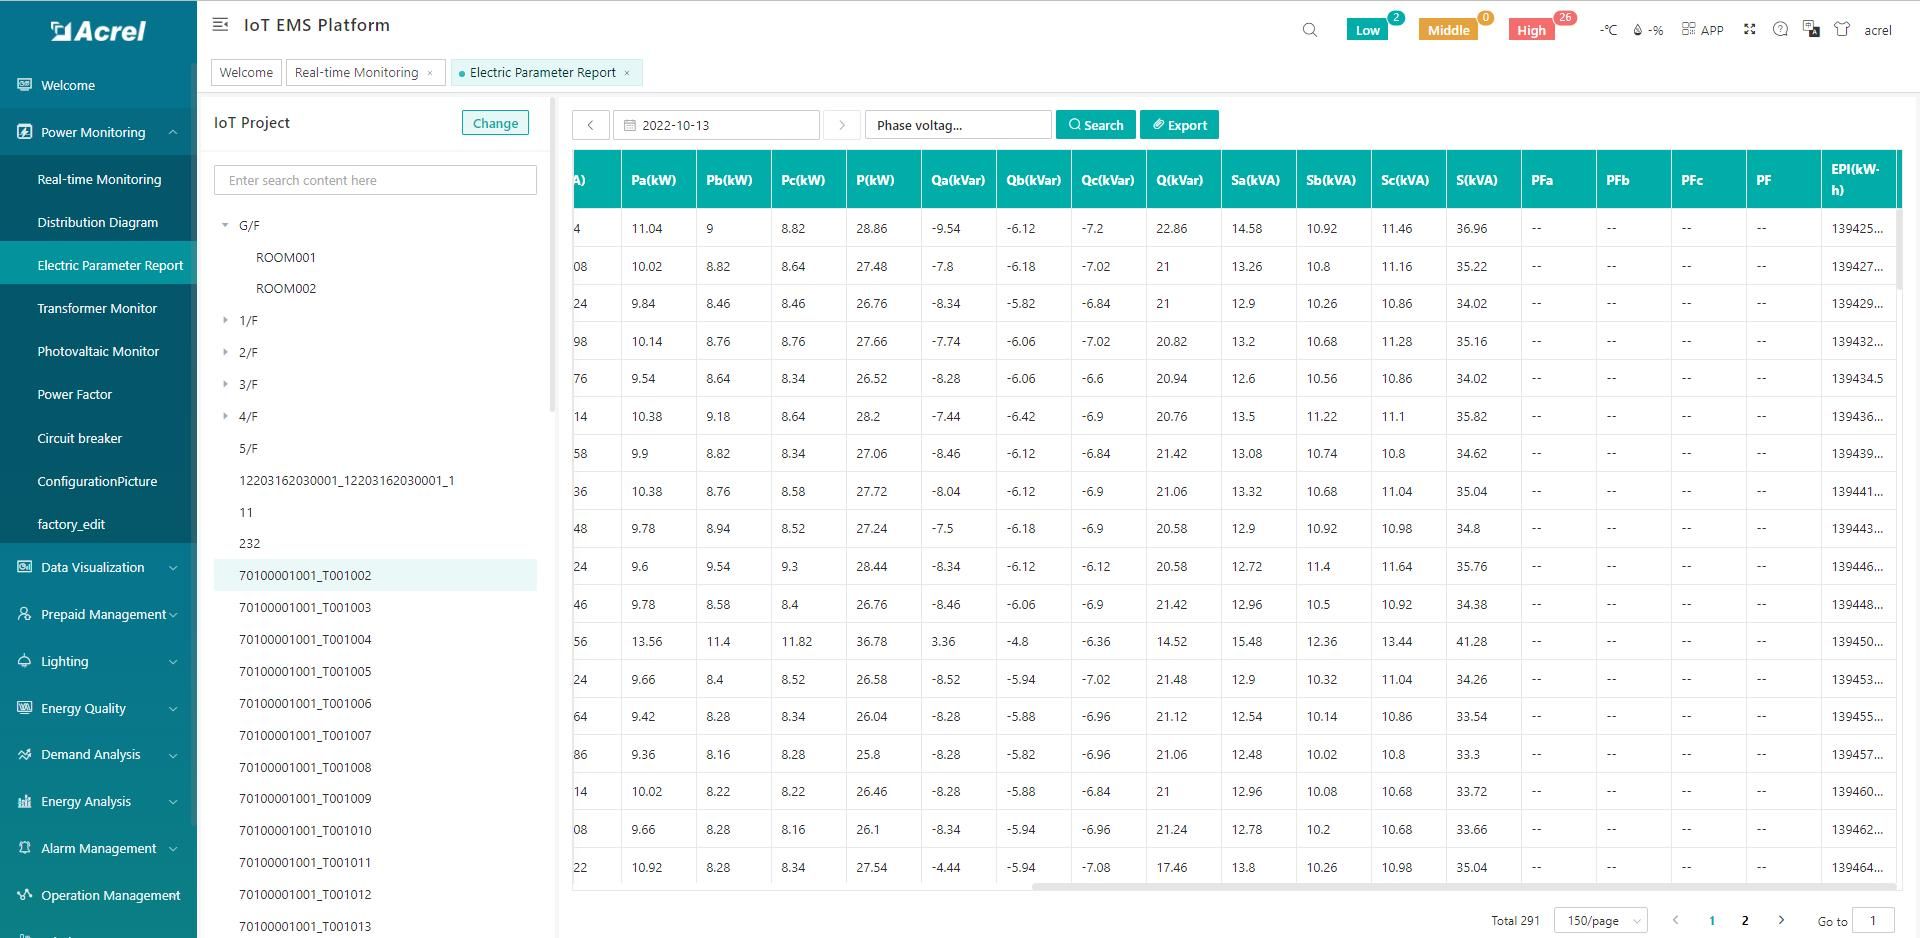
Report on platform could be exported in "Excel" format to your computer for a brief storage when accessing the IoT EMS WEB platform.
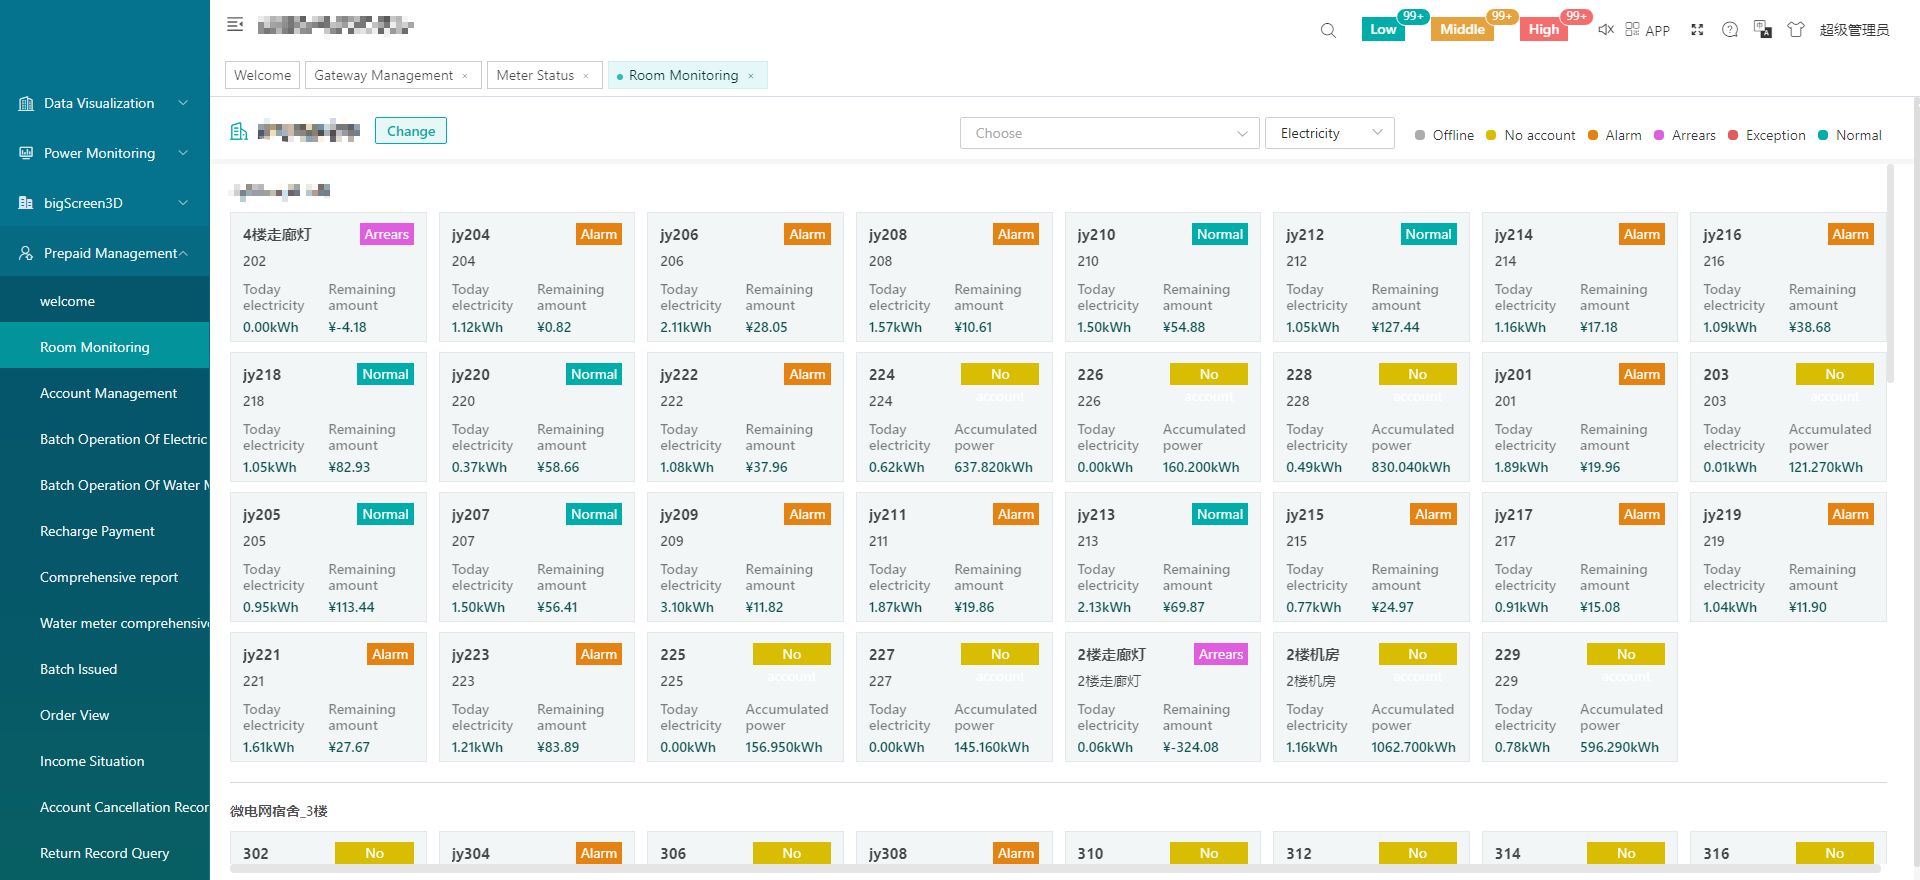
 4.5 User monitoring(shop monitoring、circuit monitoring、monitoring details)
User monitoring can quickly view the status of commercial tenants and public circuits.Abnormal rooms or circuits are marked with abnormal colors, which can be quickly located.
The interface of room monitoring and circuit monitoring can quickly filtrate the corresponding users and circuits by program area and floor distribution,and it can return to the interface of monitoring details by clicking tripping.
4.5 User monitoring(shop monitoring、circuit monitoring、monitoring details)
User monitoring can quickly view the status of commercial tenants and public circuits.Abnormal rooms or circuits are marked with abnormal colors, which can be quickly located.
The interface of room monitoring and circuit monitoring can quickly filtrate the corresponding users and circuits by program area and floor distribution,and it can return to the interface of monitoring details by clicking tripping.
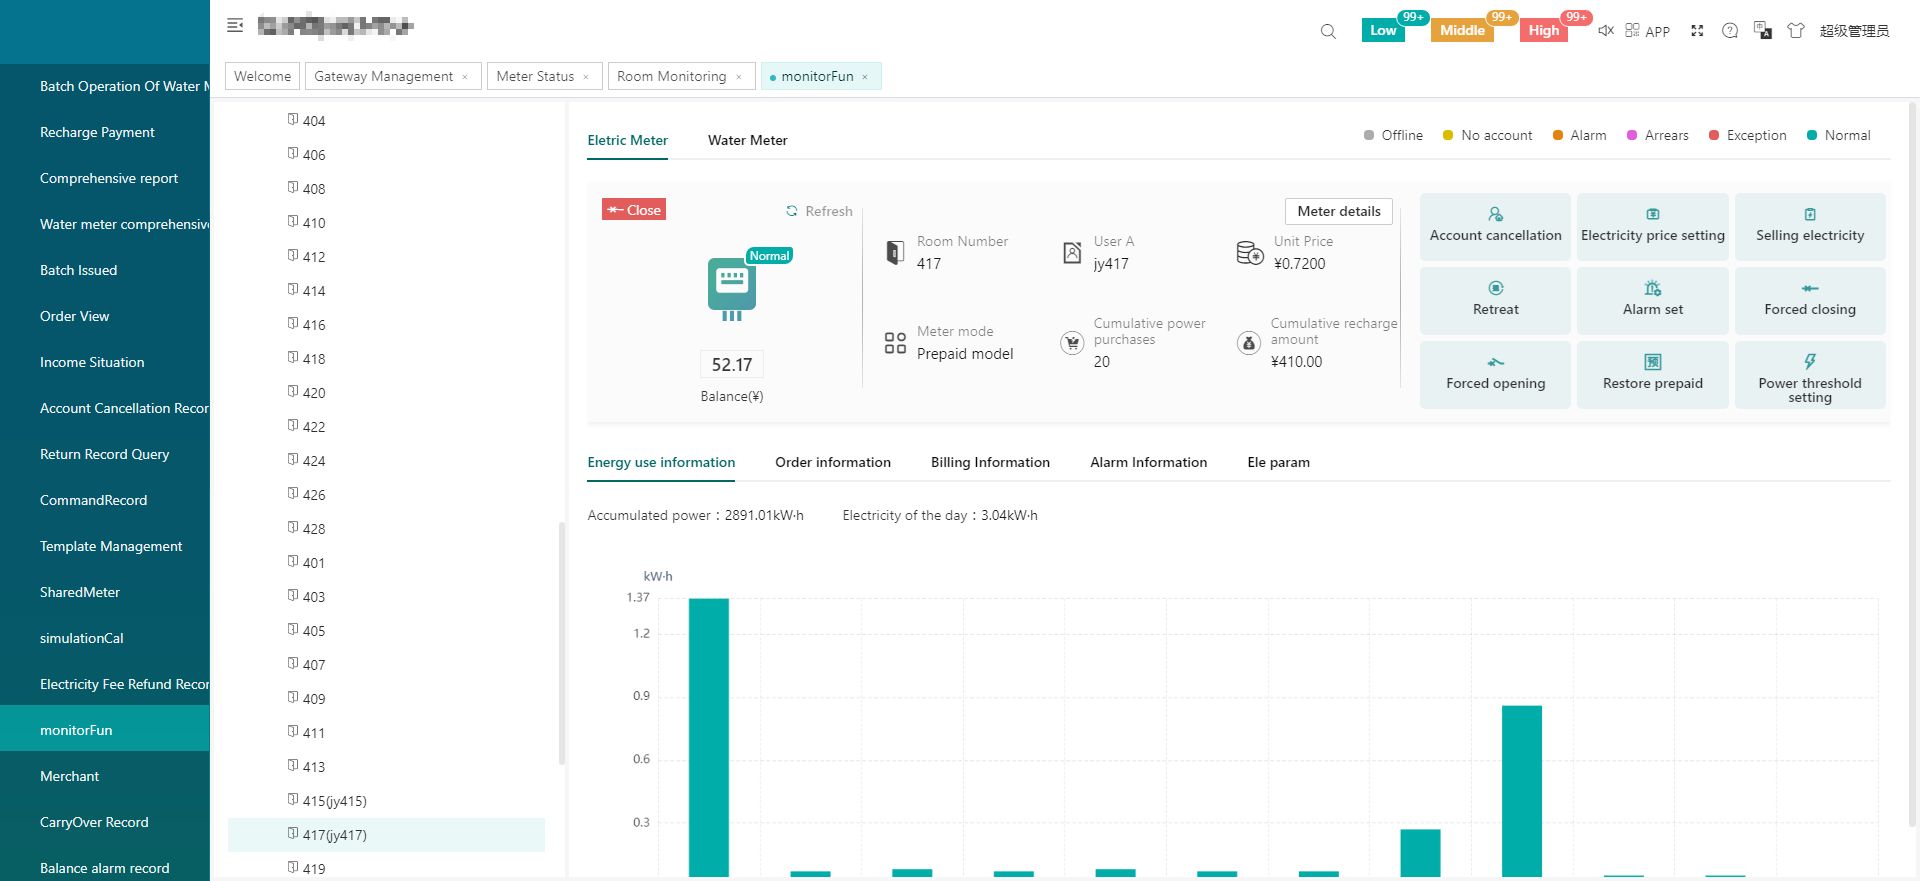
Monitoring details are the interface of shop management details.It can perform functions such as opening an account for the initial room, recharging check-in stores, detailing energy usage, recharging records, and viewing abnormal alarms.It can also perform operations such as issuing electricity price and alarm, opening and closing control.
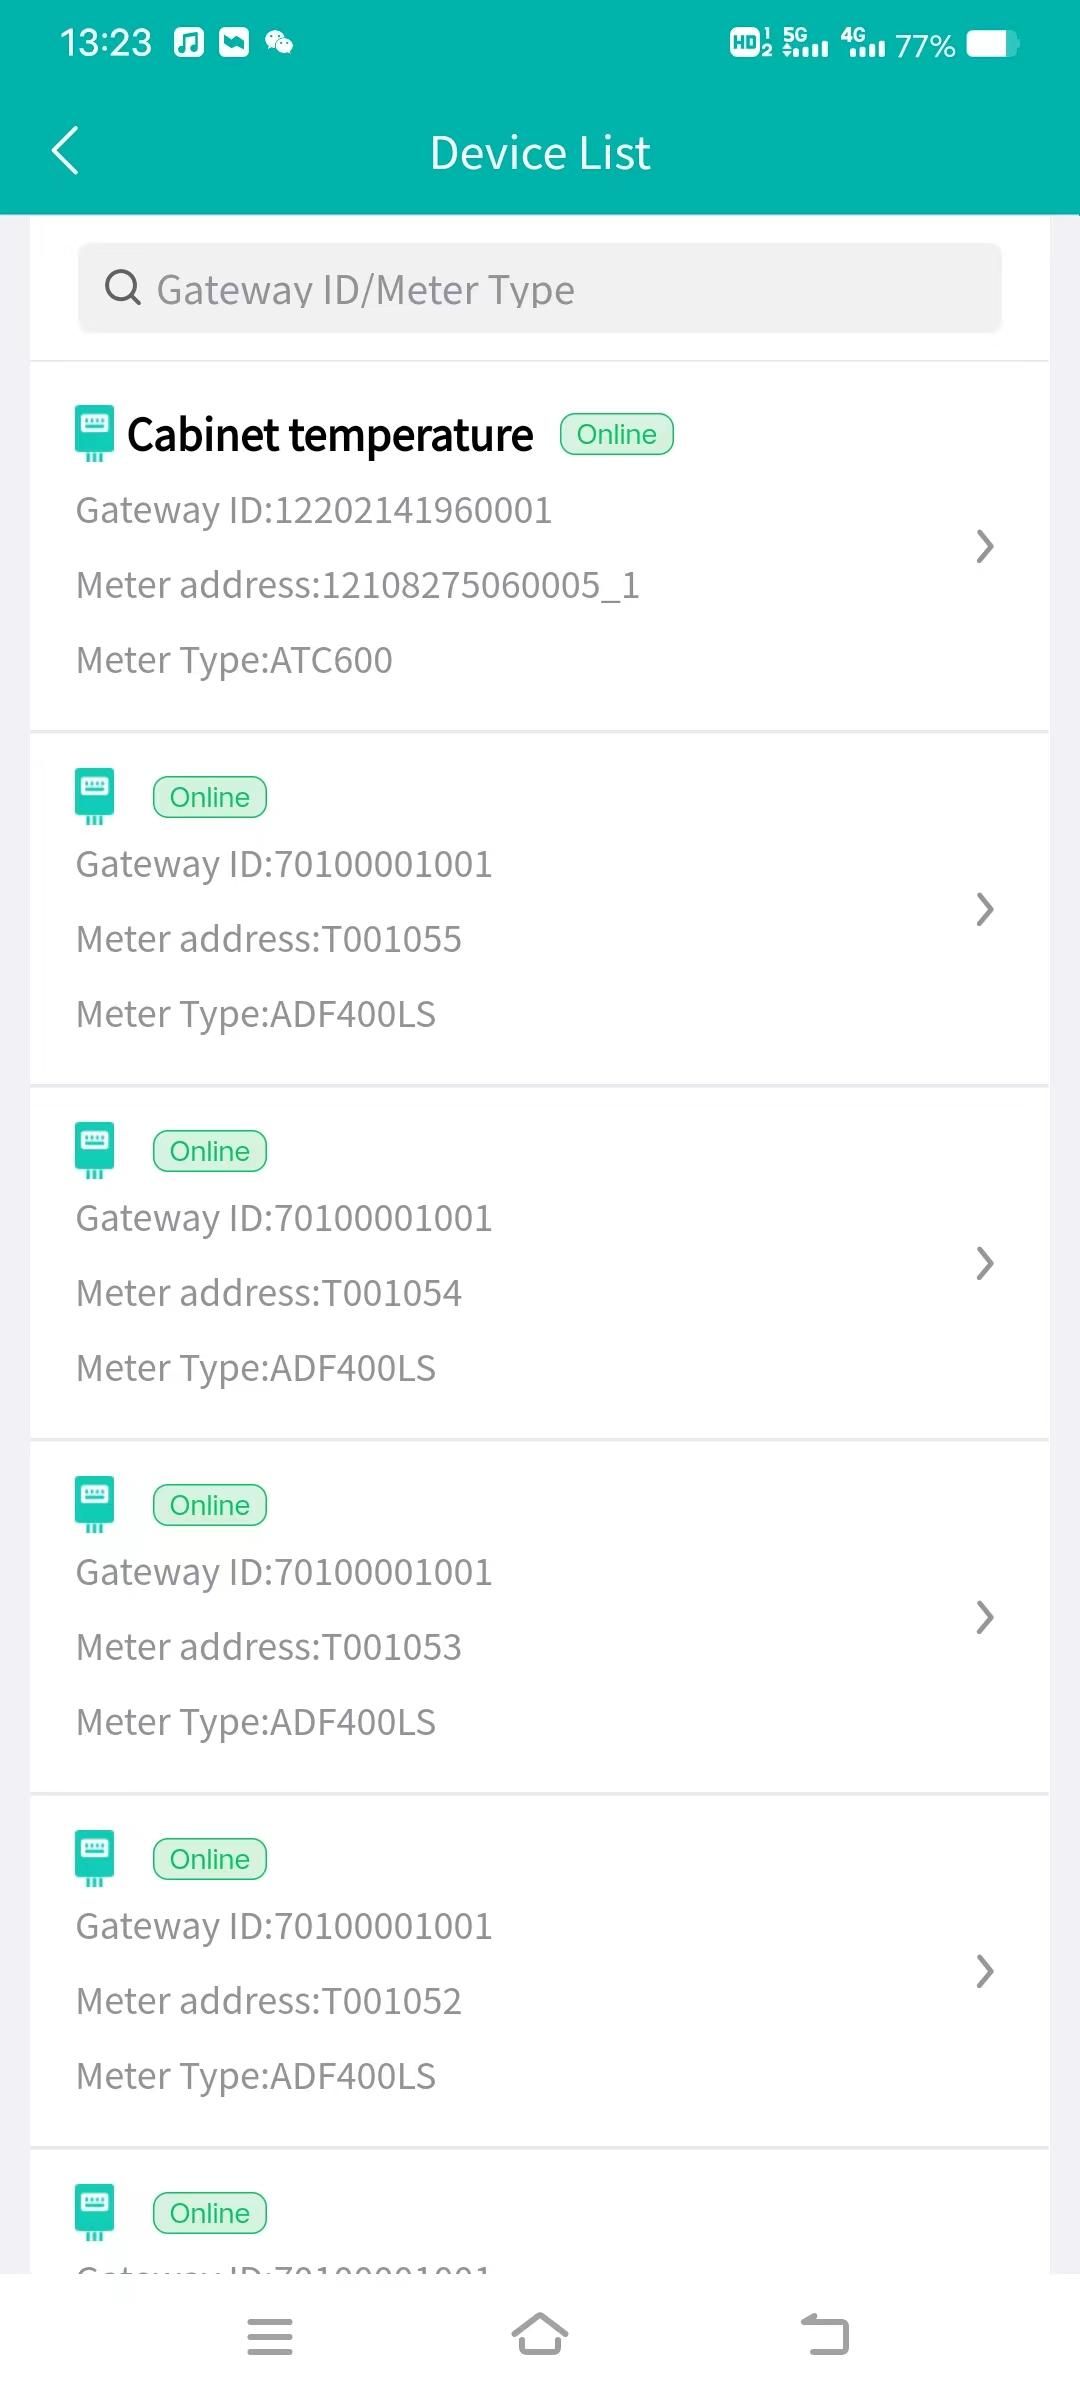
 4.6 Main Function of APP side System:
(1) Devices List (2) History Curve (3) Electricity Parameters Report (4) Energy Trend (5) Energy
Consumption Report (Daily, Monthly, Yearly)
Noted: Since APP side and WEB side of Acrel IoT Energy Monitoring System share the same data, normally recommend our user to add the devices to their account using APP and check the data
using WEB platform.
4.6 Main Function of APP side System:
(1) Devices List (2) History Curve (3) Electricity Parameters Report (4) Energy Trend (5) Energy
Consumption Report (Daily, Monthly, Yearly)
Noted: Since APP side and WEB side of Acrel IoT Energy Monitoring System share the same data, normally recommend our user to add the devices to their account using APP and check the data
using WEB platform.
Report on platform could be exported in "Excel" format to your computer for a brief storage when accessing the IoT EMS WEB platform.
Monitoring details are the interface of shop management details.It can perform functions such as opening an account for the initial room, recharging check-in stores, detailing energy usage, recharging records, and viewing abnormal alarms.It can also perform operations such as issuing electricity price and alarm, opening and closing control.